
Algorithm for determination of right atrial pressure
Right heart and pulmonary pressures
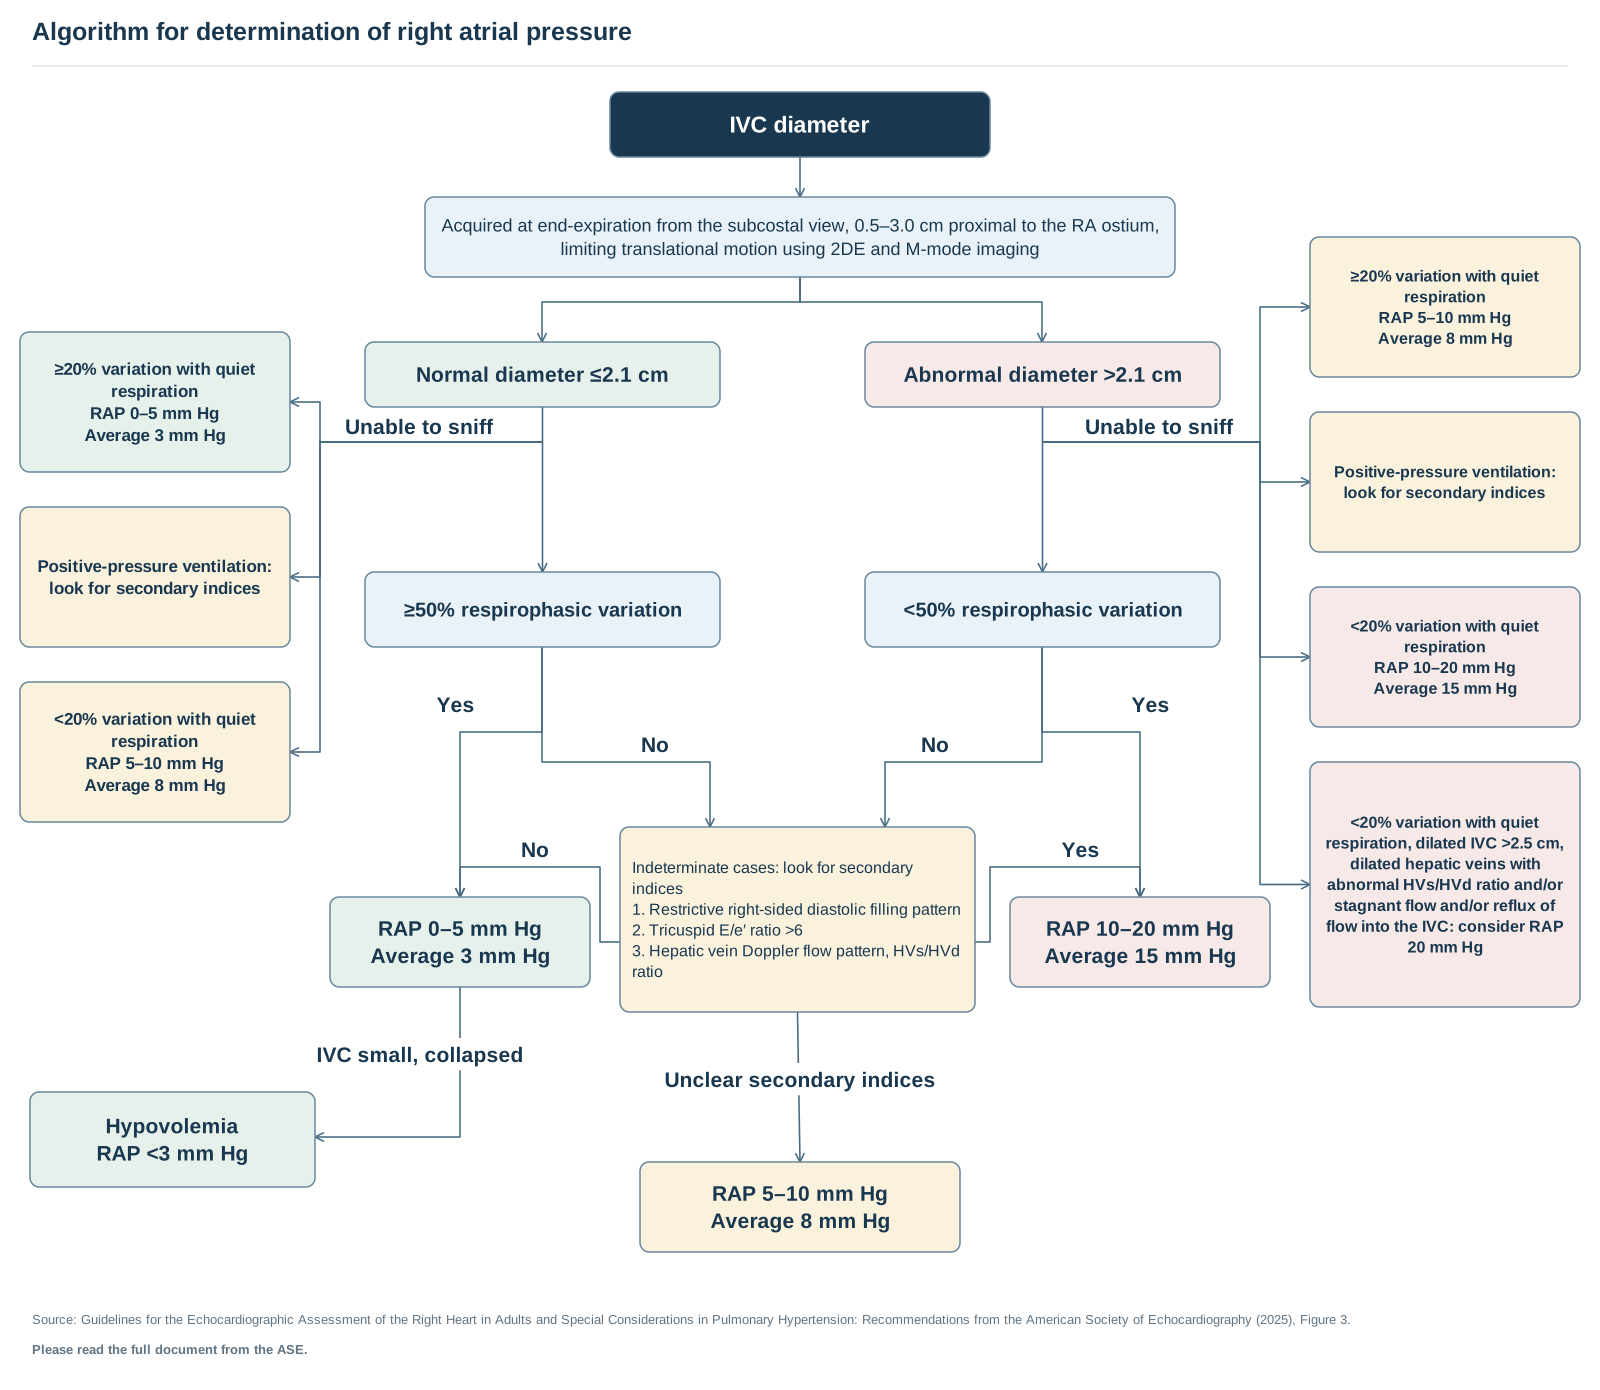
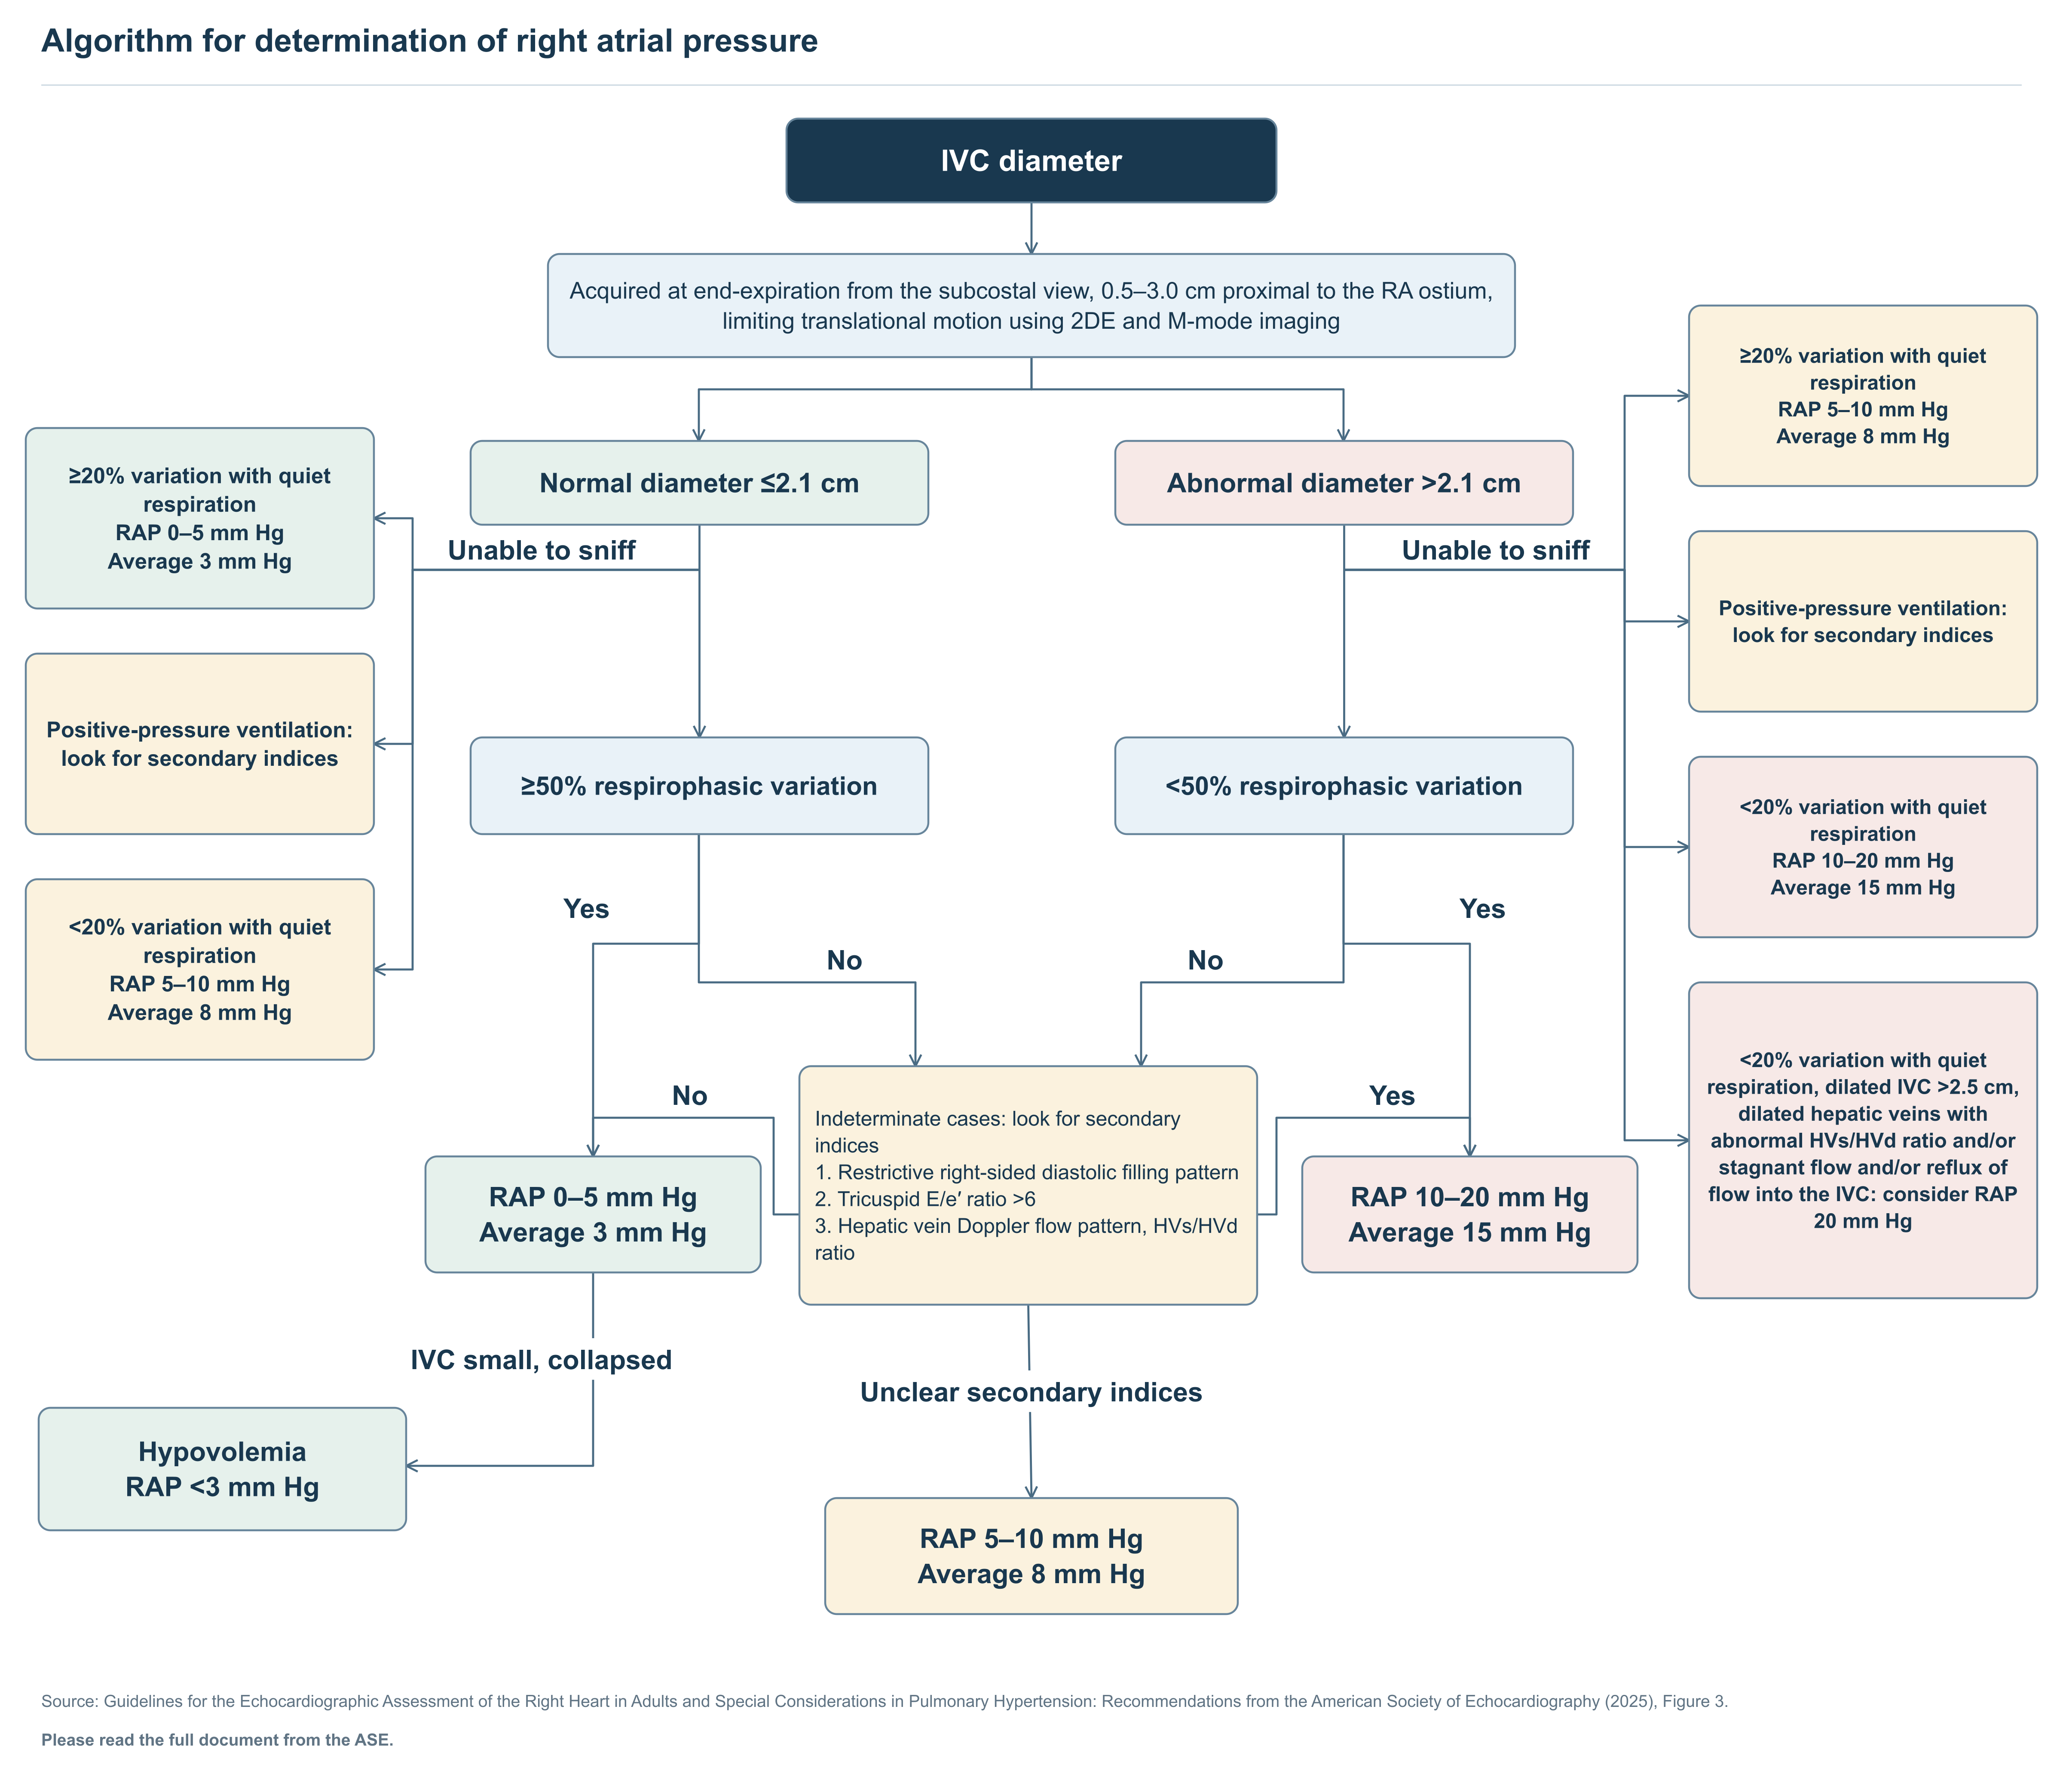
Text of this figure
- Algorithm for determination of right atrial pressure
- Yes
- No
- Yes
- No
- No
- Yes
- Unclear secondary indices
- IVC small, collapsed
- IVC diameter
- Acquired at end-expiration from the subcostal view, 0.5–3.0 cm proximal to the RA ostium,
- limiting translational motion using 2DE and M-mode imaging
- Normal diameter ≤2.1 cm
- Abnormal diameter >2.1 cm
- ≥50% respirophasic variation
- <50% respirophasic variation
- ≥20% variation with quiet
- respiration
- RAP 0–5 mm Hg
- Average 3 mm Hg
- Positive-pressure ventilation:
- look for secondary indices
- <20% variation with quiet
- respiration
- RAP 5–10 mm Hg
- Average 8 mm Hg
- ≥20% variation with quiet
- respiration
- RAP 5–10 mm Hg
- Average 8 mm Hg
- Positive-pressure ventilation:
- look for secondary indices
- <20% variation with quiet
- respiration
- RAP 10–20 mm Hg
- Average 15 mm Hg
- <20% variation with quiet
- respiration, dilated IVC >2.5 cm,
- dilated hepatic veins with
- abnormal HVs/HVd ratio and/or
- stagnant flow and/or reflux of
- flow into the IVC: consider RAP
- 20 mm Hg
- RAP 0–5 mm Hg
- Average 3 mm Hg
- RAP 10–20 mm Hg
- Average 15 mm Hg
- Indeterminate cases: look for secondary
- indices
- 1. Restrictive right-sided diastolic filling pattern
- 2. Tricuspid E/e′ ratio >6
- 3. Hepatic vein Doppler flow pattern, HVs/HVd
- ratio
- RAP 5–10 mm Hg
- Average 8 mm Hg
- Hypovolemia
- RAP <3 mm Hg
- Unable to sniff
- Unable to sniff
- Source: Guidelines for the Echocardiographic Assessment of the Right Heart in Adults and Special Considerations in Pulmonary Hypertension: Recommendations from the American Society of Echocardiography (2025), Figure 3.
- Please read the full document from the ASE.
Redrawn as a flowchart from the published document named in the figure. Read the full document for context and the figures' complete notes.